The holiday season gets plenty of attention, but The Old School Game Vault's own sales records show a stronger start to the year. Across seven complete years, from 2019 through 2025, January through March accounted for an average of 30.6% of annual online sales revenue. October through December accounted for 24.1%.
The Table of Contents
These figures come from The Old School Game Vault’s online sales. They describe our business's seasonal pattern, not the entire retro game market. We share percentages so readers can compare seasons without needing our private revenue figures. A separate snapshot below looks at what customers sold to us, using 206 completed purchase orders from August 2025 through October 2026.
Which quarter accounted for the most retro game sales?
The Old School Game Vault's first quarter had the highest average share of annual online sales revenue: 30.6%. It was also the strongest quarter in five of the seven years studied.
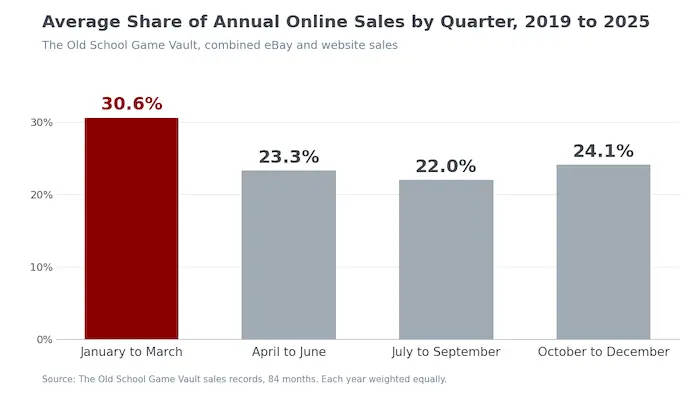
| Quarter | Average share of annual sales revenue |
|---|---|
| January to March | 30.6% |
| April to June | 23.3% |
| July to September | 22.0% |
| October to December | 24.1% |
Source: The Old School Game Vault online sales records, January 2019 to December 2025 (84 months). Each year weighted equally.
- The first quarter's average share exceeded the fourth quarter's by 6.5 percentage points.
- The pattern was especially clear from 2021 through 2025: the first quarter was the strongest in each of those five years. However, the records don't explain why shoppers spent more during those months. Tax refunds, holiday gift money, and collecting habits could explain this, but these figures don't prove them.
Which month had the largest average share of sales?
The Old School Game Vault's March sales averaged 11.3% of annual revenue, the highest monthly share in the seven-year comparison. January and February followed at 9.7% and 9.6%.
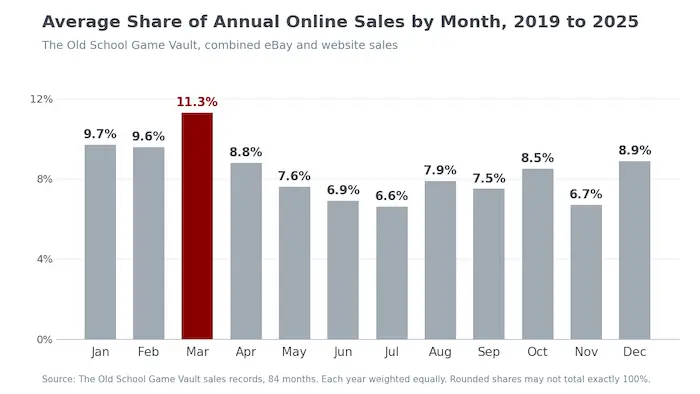
| Month | Average share of annual sales revenue |
|---|---|
| January | 9.7% |
| February | 9.6% |
| March | 11.3% |
| April | 8.8% |
| May | 7.6% |
| June | 6.9% |
| July | 6.6% |
| August | 7.9% |
| September | 7.5% |
| October | 8.5% |
| November | 6.7% |
| December | 8.9% |
Source: The Old School Game Vault online sales records, January 2019 to December 2025 (84 months). Each year weighted equally. Rounded monthly percentages may not total exactly 100%.
- February has the fewest days but nearly matched January's share of annual sales. After dividing each month's share by its number of days in each year and averaging across the seven years, February's daily sales share was 8.4% higher than January's. That makes February's performance stronger than the monthly totals alone suggest.
- March was the highest-revenue month in 2023, 2024, and 2025. That repeat pattern is worth reporting, but it doesn't mean March will lead every future year.
Are summer months always slower?
The Old School Game Vault's July-to-September sales had the lowest average quarterly share, at 22.0%, but summer wasn't consistently slow every year. July had the lowest average monthly share, at 6.6%, narrowly below November's 6.7%.
- The clearest exception was 2020. July was our highest-revenue month that year, and July through September was the strongest quarter. That difference matters: a seven-year average should not hide a year that followed a substantially different pattern.
- We kept 2020 in the averages. The figures alone don't show what drove that year's pattern.
Did holiday sales lead every year?
The Old School Game Vault's holiday quarter didn't lead the seven-year average, though it was the strongest quarter in 2019. December remained a meaningful sales month, averaging 8.9% of annual revenue.
- November was the lowest-revenue month in 2022, 2023, and 2024. But that didn't continue in 2025, when July was lowest, and December revenue fell below November's. We therefore cannot describe a November low followed by a December rebound as a dependable rule.
- The useful finding is that our sales extend well beyond the holiday shopping period, with a particularly strong first quarter in recent years.
What retro games and systems are people selling to us?
PlayStation 3 items led The Old School Game Vault's purchase records by unit count at 14.0%, while GameCube led by share of quoted purchase amounts at 11.4%. The records cover 5,577 listed units across 206 completed orders dated August 7, 2025, through October 29, 2026.
- This is a separate snapshot of what customers sold to us. The seven-year figures above measure what shoppers bought from us. The two datasets cover different periods and should not be treated as matching purchases and resales of the same items.
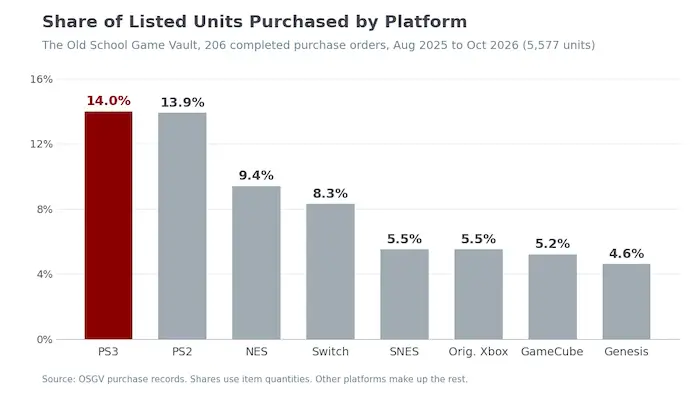
| Platform | Listed units purchased | Share of all listed units |
|---|---|---|
| PlayStation 3 | 778 | 14.0% |
| PlayStation 2 | 774 | 13.9% |
| Nintendo NES | 525 | 9.4% |
| Nintendo Switch | 465 | 8.3% |
| Super Nintendo | 307 | 5.5% |
| Original Xbox | 304 | 5.5% |
| GameCube | 289 | 5.2% |
| Sega Genesis | 258 | 4.6% |
Source: The Old School Game Vault completed purchase records, August 7, 2025, to October 29, 2026 (206 orders). Shares use item quantities. Platforms not shown make up the remaining share.
- PS3, PS2, and NES items together accounted for 37.2% of all listed units.
- Units include games, consoles, accessories, and bundles. A console bundle counts as one listed unit, rather than counting each included component separately.
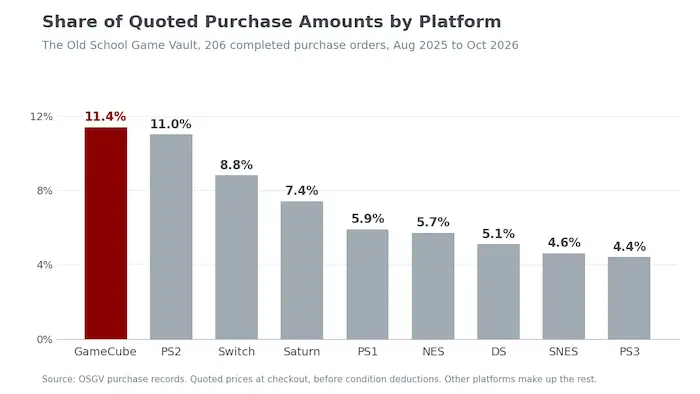
| Platform | Share of quoted purchase amounts |
|---|---|
| GameCube | 11.4% |
| PlayStation 2 | 11.0% |
| Nintendo Switch | 8.8% |
| Sega Saturn | 7.4% |
| PlayStation 1 | 5.9% |
| Nintendo NES | 5.7% |
| Nintendo DS | 5.1% |
| Super Nintendo | 4.6% |
| PlayStation 3 | 4.4% |
Source: The Old School Game Vault completed purchase records, August 7, 2025, to October 29, 2026 (206 orders). Amounts reflect quoted prices at checkout, before any condition deductions. Platforms not shown make up the remaining share.
- The difference between the two tables matters. PS3 led the unit count but accounted for only 4.4% of quoted purchase amounts, while GameCube led spending with fewer units. Neither table establishes a price for any individual game or a trend across the entire market.
- The median order contained 18 listed units. The average was 27.1 units, with larger collections pulling the average upward. The largest recorded order contained 556 units.
Which months brought in the most selling orders?
The Old School Game Vault's purchase records show the most orders in October 2025, with 29. June 2026 had the most listed units, with 877 across 14 orders.
- Those findings show how order counts and collection sizes can tell different stories. A few large collections can outweigh many smaller orders.
- Earlier purchase records were not retained, so these results don't establish our busiest buying season. August 2025 and October 2026 cover only part of those months. Order dates show when customers placed their selling orders, not when packages arrived or payments were issued.
What can these records tell shoppers and sellers?
The Old School Game Vault's sales records show when we earned revenue. They don't show the cheapest month to buy a game, the best month to sell a collection, or how many shoppers buy each month.
- Revenue can change because of the number of orders, prices, available inventory, or the mix of products sold. A high-value console bundle can contribute more revenue than several inexpensive games. Without separating those factors, sales dollars should not be treated as a direct count of shoppers or games.
- Purchase unit counts show the volume of items we bought, while shares of quoted purchase amounts show how spending was distributed across platforms. Neither measure tells you what a particular game will sell for.
- For our business, the findings mean we should pay close attention to inventory and customer service early in the year and during the holidays. For readers, they offer a documented look at one established retro game business's seasonal sales experience.
How did we calculate the sales and purchase findings?
The Old School Game Vault used January-December “Online Sales” figures in its monthly profit-and-loss summaries for 2019 through 2025. The records combine our yearly online sales from The Old School Game Vault’s online store and eBay store, as confirmed by founder Brandon Perton.
- For each year, we divided each month's recorded sales revenue by that year's total recorded sales revenue. We then averaged the seven percentages for each calendar month. Quarterly shares use the same method, combining the appropriate three months. Each year carries equal weight, so a higher-revenue year does not dominate the seasonal average.
- The analysis includes 84 months across seven complete calendar years. It uses the recorded Online Sales row without separately adjusting for refunds, shipping, taxes, product categories, or selling channels. Annual totals calculated from the twelve monthly entries reconcile with the totals recorded in the source summaries.
- These numbers come from one business. Changes in inventory, pricing, listings, and operations, along with customer demand, can affect sales. Monthly and quarterly shares are not adjusted for the number of days. The separate February comparison divides each month's share by its actual number of days, including leap years, before averaging across the seven years. Incomplete 2017 summaries and partial 2026 results are excluded.
For the separate purchase snapshot, The Old School Game Vault used completed purchase records dated August 7, 2025, through October 29, 2026. Founder Brandon Perton confirmed these were completed purchases.
- We counted each dated order group once, carried its date through its product rows, and totaled quantities. Rows containing only bundle options were excluded, and platform naming variations, such as PS2 and PlayStation 2, were combined. The 206 orders contain 5,417 product rows totaling 5,577 listed units. Collection sizes use each order's total product quantity.
- Purchase-amount shares divide each product row's quoted line total by the sum across all product rows. Every line total matches quantity multiplied by unit price. These are quoted prices at checkout, before any condition deductions made after an order arrived. Dollar totals and customer details are not published.
- Earlier purchase records were not retained, and missing orders were not estimated or replaced. These records cover a different period from the seven-year sales summaries and do not track the same items from purchase through resale.
The Old School Game Vault is a nationwide mail-in retro video game buyer and online store that has operated since 2008.